【其三】使用Filebeat解析你的SpringBoot日志到Elasticsearch
1. 前言
这是最后一部分,内容是使用Filebeat解析你的SpringBoot日志到Elasticsearch,并且能在Kibana上对你产生的日志进行分析。
前两节内容的部分你可以在如下地址找到:
【其一】安装新版的Elasticsearch(8.8.0)与Kibana(8.8.0)
【其二】SpringBoot响应式编程集成Elasticsearch
可能你会有疑问,为什么不使用logstash呢?
确实Filebeat和Logstash都是Elastic Stack中用于收集、解析和发送日志数据的工具,但是对于个人开发者来说,Filebeat比Logstash轻量级很多,而且配置也简单不少,只要一个yml配置即可指定日志文件,然后docker容器一拉起来就完成了。日志数据分析什么的,其实现在还没有这么多精力去折腾,需求只是把不同服务器的日志同步到一个ES中,这样可以方便在Kibana上一次性看到不同服务器不同应用和API的日志,而不用一个个ssh连接上去,cd到指定目录,等待less命令滚动好一会儿才到最新的日志。
2. Filebeat介绍
首先放一下Filebeat的官方文档,这是大多数信息的来源。Filebeat Reference
Filebeat是一个轻量级、高效的工具,Filebeat的主要目标是从各种数据源(如日志文件、系统日志、应用程序输出等)收集日志数据,并将其传输到Elasticsearch或Logstash等目标存储或处理系统。
是的Filebeat也可以搭配logstash使用,所以后续有升级再安排logstash也不迟。
3. Filebeat使用
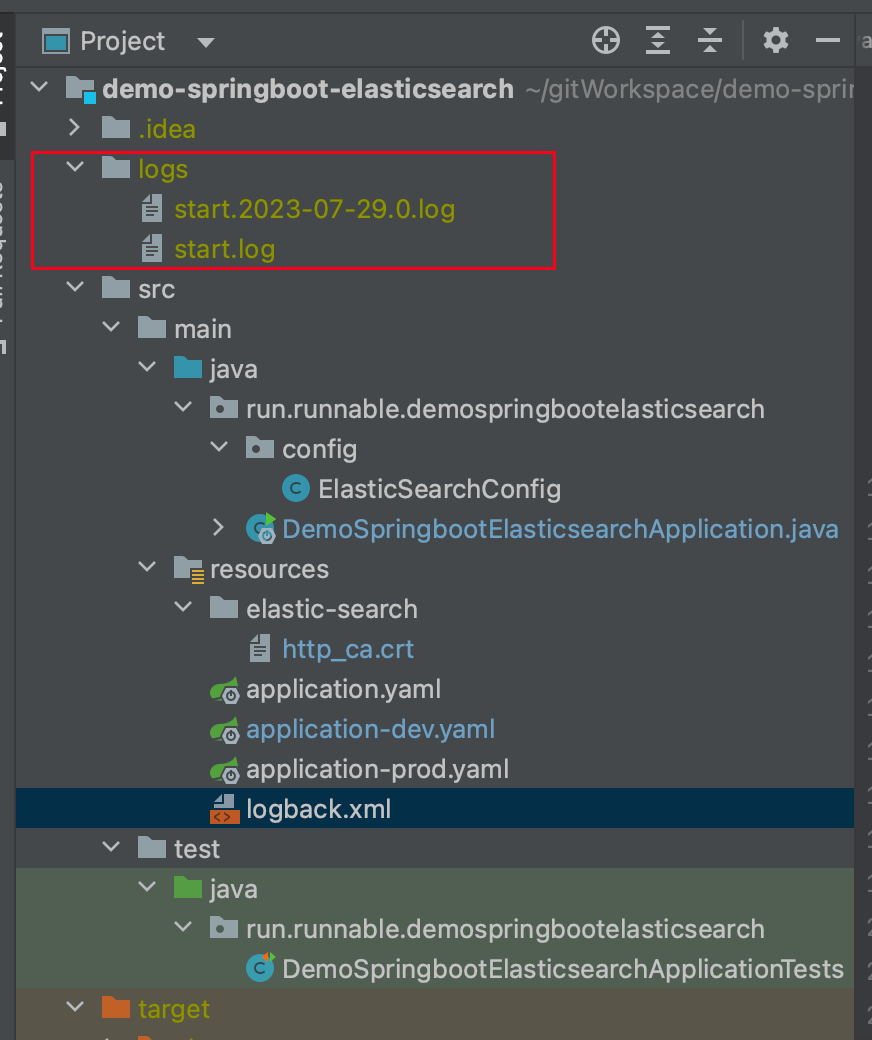
在使用前,我们要做的第一件事就是,找到日志的位置,如果你是根据前两节博客看过来的,那么在项目**demo-springboot-elasticsearch** 中,log会生成的路径配置logback.xml 中
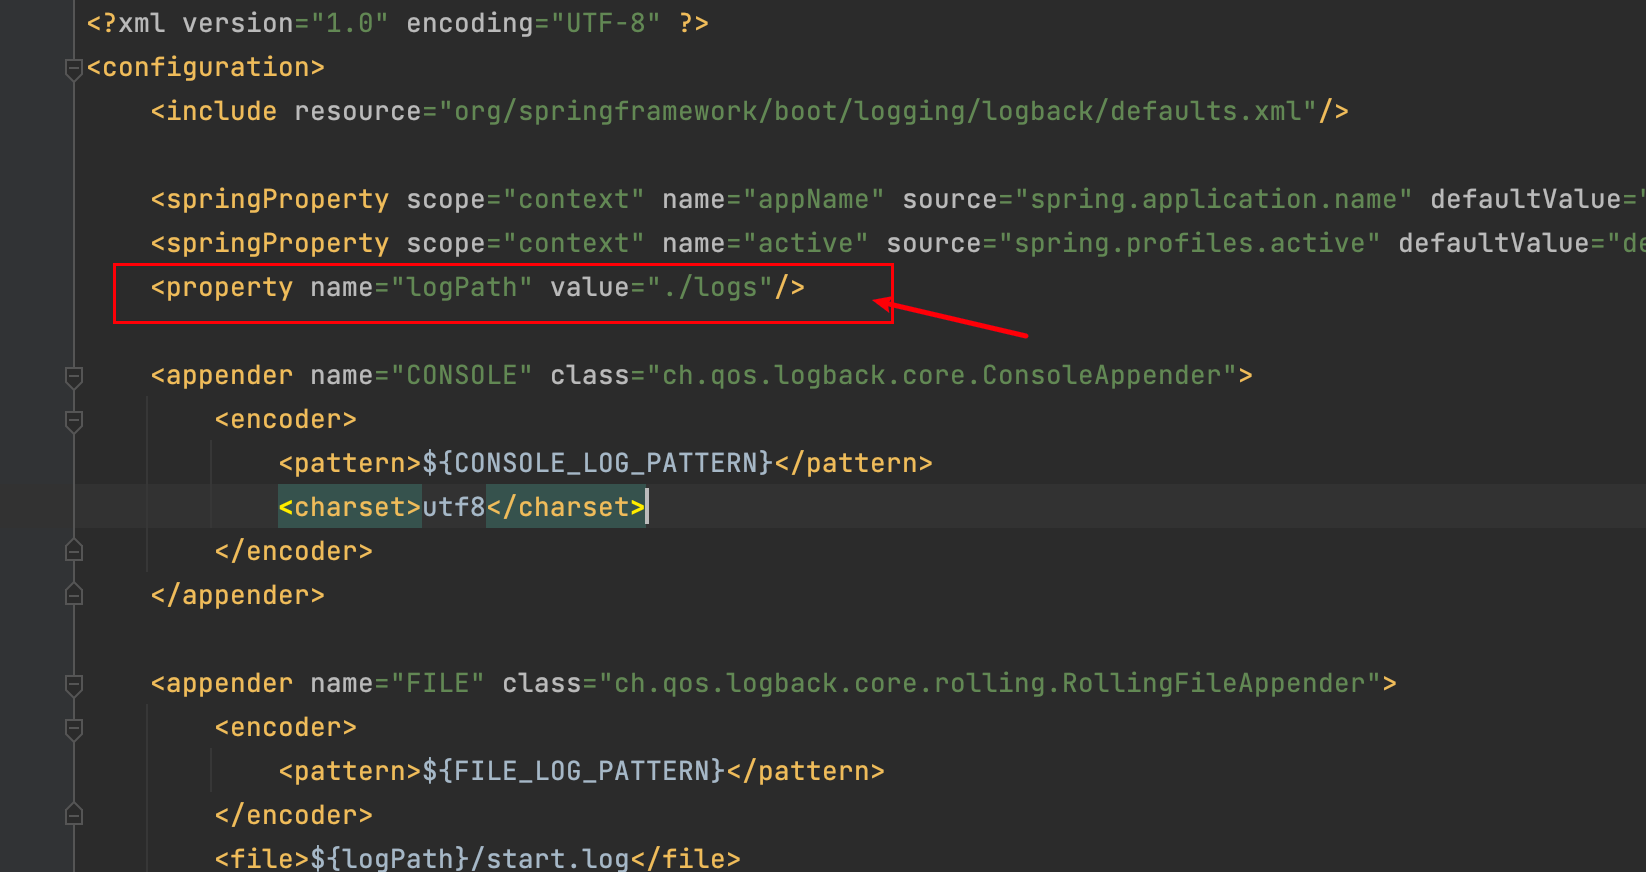
默认是会生成到当前项目的目录下,所以你需要记录一下日志目录的绝对路径,这个等待会用到。
3.1 准备http_ca.crt和filebeat.yml配置文件
知道日志路径了,那么我们可以开始准备安装Filebeat了,这里依然是采取docker 部署的方案。
http_ca.crt 不知道你是否还有印象,在新版的ES中,需要通过这个建立SSL连接,这里也是需要的。你可以再从ES容器中复制一个出来,如下命令会把http_ca.crt直接复制到当前目录。
docker cp elasticsearch:/usr/share/elasticsearch/config/certs/http_ca.crt .
接着我们直接下载一个filebeat.yml的模板文件
curl -L -O https://raw.githubusercontent.com/elastic/beats/8.9/deploy/docker/filebeat.docker.yml
下载比较慢的同学可以直接用下面这个内容,也是一样的
filebeat.config:
  modules:
    path: ${path.config}/modules.d/*.yml
    reload.enabled: false

filebeat.autodiscover:
  providers:
    - type: docker
      hints.enabled: true

processors:
- add_cloud_metadata: ~

output.elasticsearch:
  hosts: '${ELASTICSEARCH_HOSTS:elasticsearch:9200}'
  username: '${ELASTICSEARCH_USERNAME:}'
  password: '${ELASTICSEARCH_PASSWORD:}'
然后我们对这个模板文件改改,改成根据你的环境改成如下样子:
#这个不用变,这个是filebeat内置了一些模块可以帮我们解析日志,比如nginx之类的,
#这里我们springboot日志不通过这个解析
filebeat.config:
  modules:
    path: ${path.config}/modules.d/*.yml
    reload.enabled: false

#日志文件输入到filebeat的来源
filebeat.inputs:
- type: filestream
  enabled: true
  id: demo-springboot-elasticsearch
  paths:
    - /share/Develop/dockerData/runnable-run/demo-springboot-elasticsearch/logs/*.log
  pipeline: springboot_pipeline
  tags: ["demo-springboot-elasticsearch"]

processors:
  - add_cloud_metadata: ~

#filebeat输出的配置,是你的ES配置
output.elasticsearch:
  hosts: ['https://ip:9200']
  username: 'elastic'
  password: 'password'
  ssl:
    enabled: true
#http_ca.crt
    certificate_authorities: "/usr/share/filebeat/http_ca.crt"
  setup.kibana:
    host: "ip:5601"
    username: "elastic"
    password: "password"
  indices:
    - index: "demo-springboot-elasticsearch"
      when.contains:
        tags: "demo-springboot-elasticsearch"
上面一些配置的说明:
type: filestream 这个类型有挺多,不够在这里我们需要让filebeat读取的是.log文件,所以使用filestream即可id: demo-springboot-elasticsearch:指定一个唯一的ID,用于标识这个输入配置。paths:指定要监控的日志文件的路径。
/share/Develop/dockerData/runnable-run/demo-springboot-elasticsearch/logs/*.log:这里使用通配符*匹配指定目录下所有以.log为后缀的日志文件。Filebeat将监控这些文件中的日志数据。
pipeline: springboot_pipeline 这个说的是日志推送到ES之后,需要ES用哪个pipeline 解析日志,等等我们会说到这个。tags: ["demo-springboot-elasticsearch"] 为从这个输入源收集的所有日志事件添加一个标签(tag)。这个标签可以帮助您在后续的处理中识别特定的日志数据来源。output.elasticsearch:这部分指定了Filebeat将日志数据发送到Elasticsearch的配置。hosts: ['https://ip:9200']:指定Elasticsearch集群的主机地址和端口。在这里使用https协议进行安全连接。username: 'elastic':连接Elasticsearch时使用的用户名。password: 'password':连接Elasticsearch时使用的密码。ssl.enabled: true:启用SSL/TLS安全连接,确保数据传输的安全性。certificate_authorities: "/usr/share/filebeat/http_ca.crt":指定CA证书文件的路径,用于验证与Elasticsearch之间的连接。这个等等证书我们要通过docker挂载进去,所以路径可以不变setup.kibana:这部分用于配置Filebeat与Kibana之间的连接。host: "ip:5601":指定Kibana的主机地址和端口。username: "elastic":连接Kibana时使用的用户名。password: "password":连接Kibana时使用的密码。indices:这部分指定了将日志数据写入Elasticsearch时的索引配置。index: "demo-springboot-elasticsearch":指定索引名称为"demo-springboot-elasticsearch",Filebeat将会将收集到的日志数据写入该索引。when.contains:这里是一个条件判断,表示当日志事件包含特定标签"demo-springboot-elasticsearch"时,将其写入到上述指定的索引中。
filebeat有大佬已经整理好了挺多的模板,可以看这篇博客:filebeat自定义索引名,filebeat索引模板
当你配置好后,别着急,还没到启动容器那一步,先去Kibana配置一下刚刚filebeat.yml文件中的springboot_pipeline ,这个springboot_pipeline 是告诉ES要怎么解析你的日志,总不能把日志丢上去,啥也不管吧。
3.2 创建pipeline解析SpringBoot日志
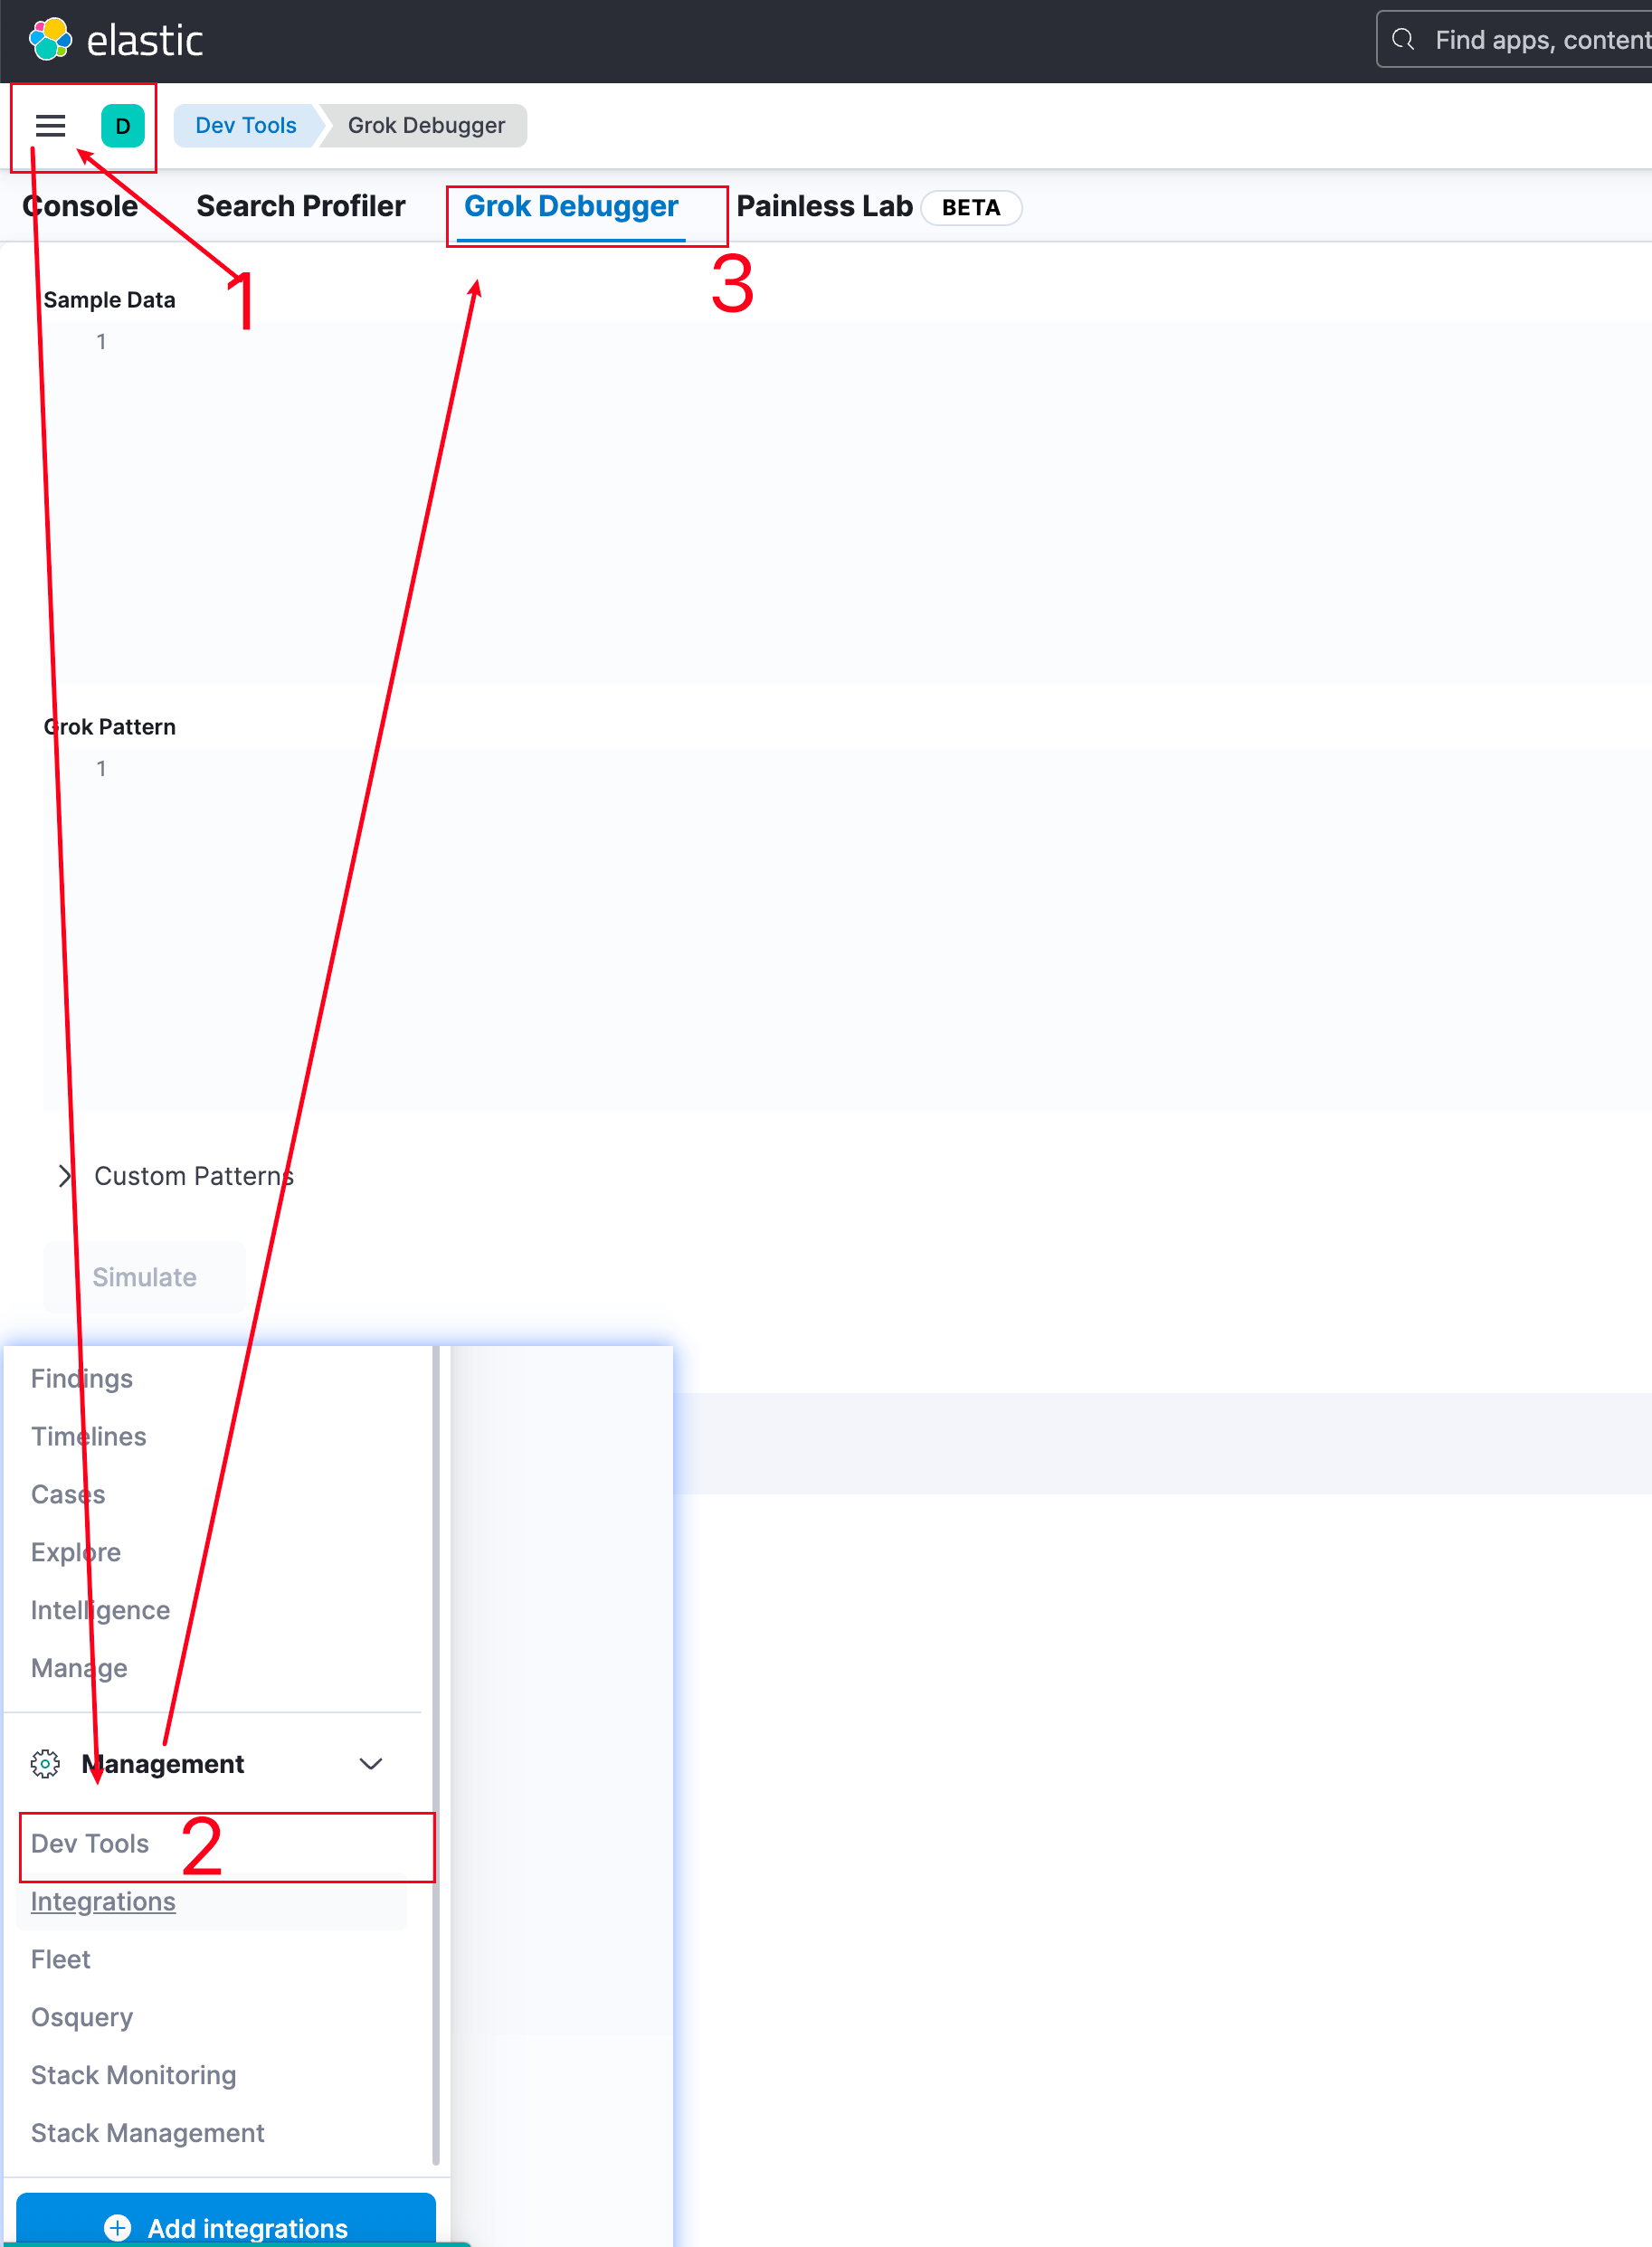
登录Kibana,我们可以先去Dev Tools中写一下解析SpringBoot日志的语法。
当然这部分你可以直接跳过,用之前我已经写好的,这部分内容是告诉你如果日志推送了ES,但是在ES没有找到对应的索引,或者索引没有数据那么需要通过这样的方式排查你的pipeline解析是否有问题。
在Sample Data中填一些SpringBoot日志样本,我知道有些同学用的日志格式是自定义的
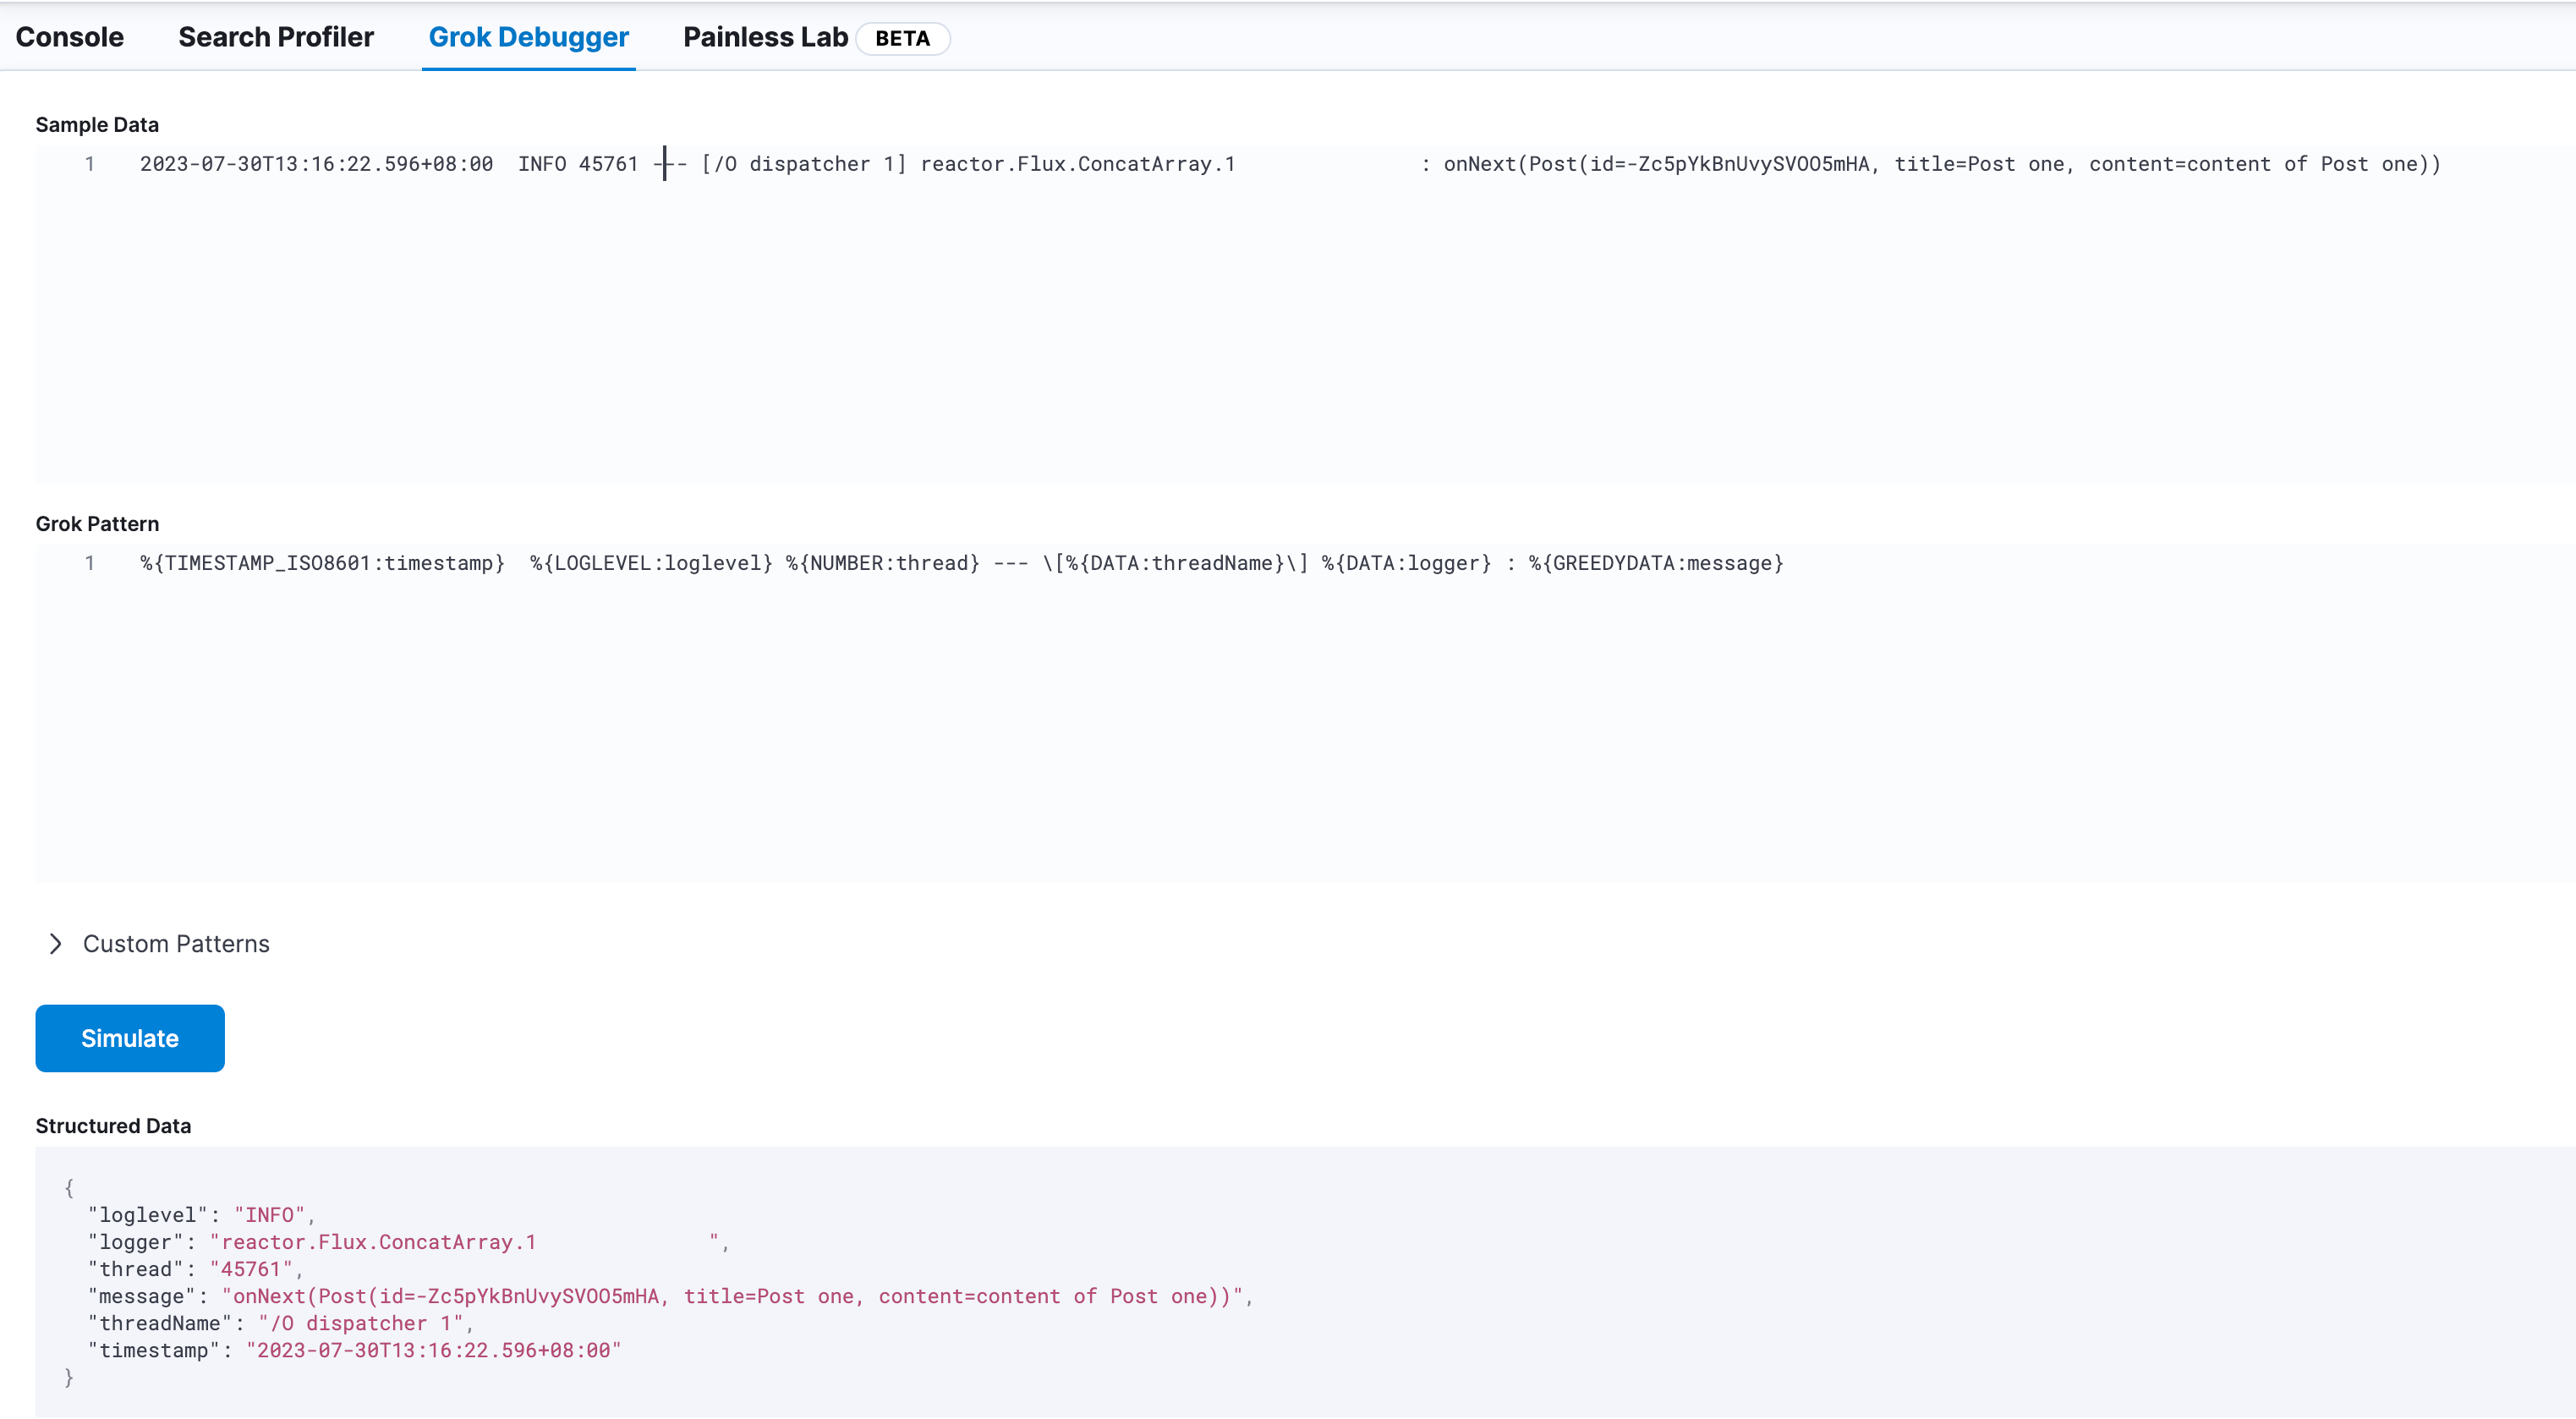
然后在下方的Grok Pattern中写匹配语法,ES有个页面是用来说这个 Grok Pattern怎么玩的,你能在这里找到:https://www.elastic.co/guide/en/logstash/current/plugins-filters-grok.html
如下是我使用的:
%{TIMESTAMP_ISO8601:timestamp} %{LOGLEVEL:loglevel} %{NUMBER:thread} --- \[%{DATA:threadName}\] %{DATA:logger} : %{GREEDYDATA:message}
%{TIMESTAMP_ISO8601:timestamp} %{}用来表示一个解析的表达式,TIMESTAMP_ISO8601表示匹配规则,timestamp表示之后生成的字段名字。
然后点击下面的Simulate ,正确匹配上的话,那么就会显示解析出来的字段,如果有问题那么会在页面右下角提示报错的。
接着回到Console页面,用你能匹配日志的Grok Pattern替换patterns,可能需要增加\ 转义符
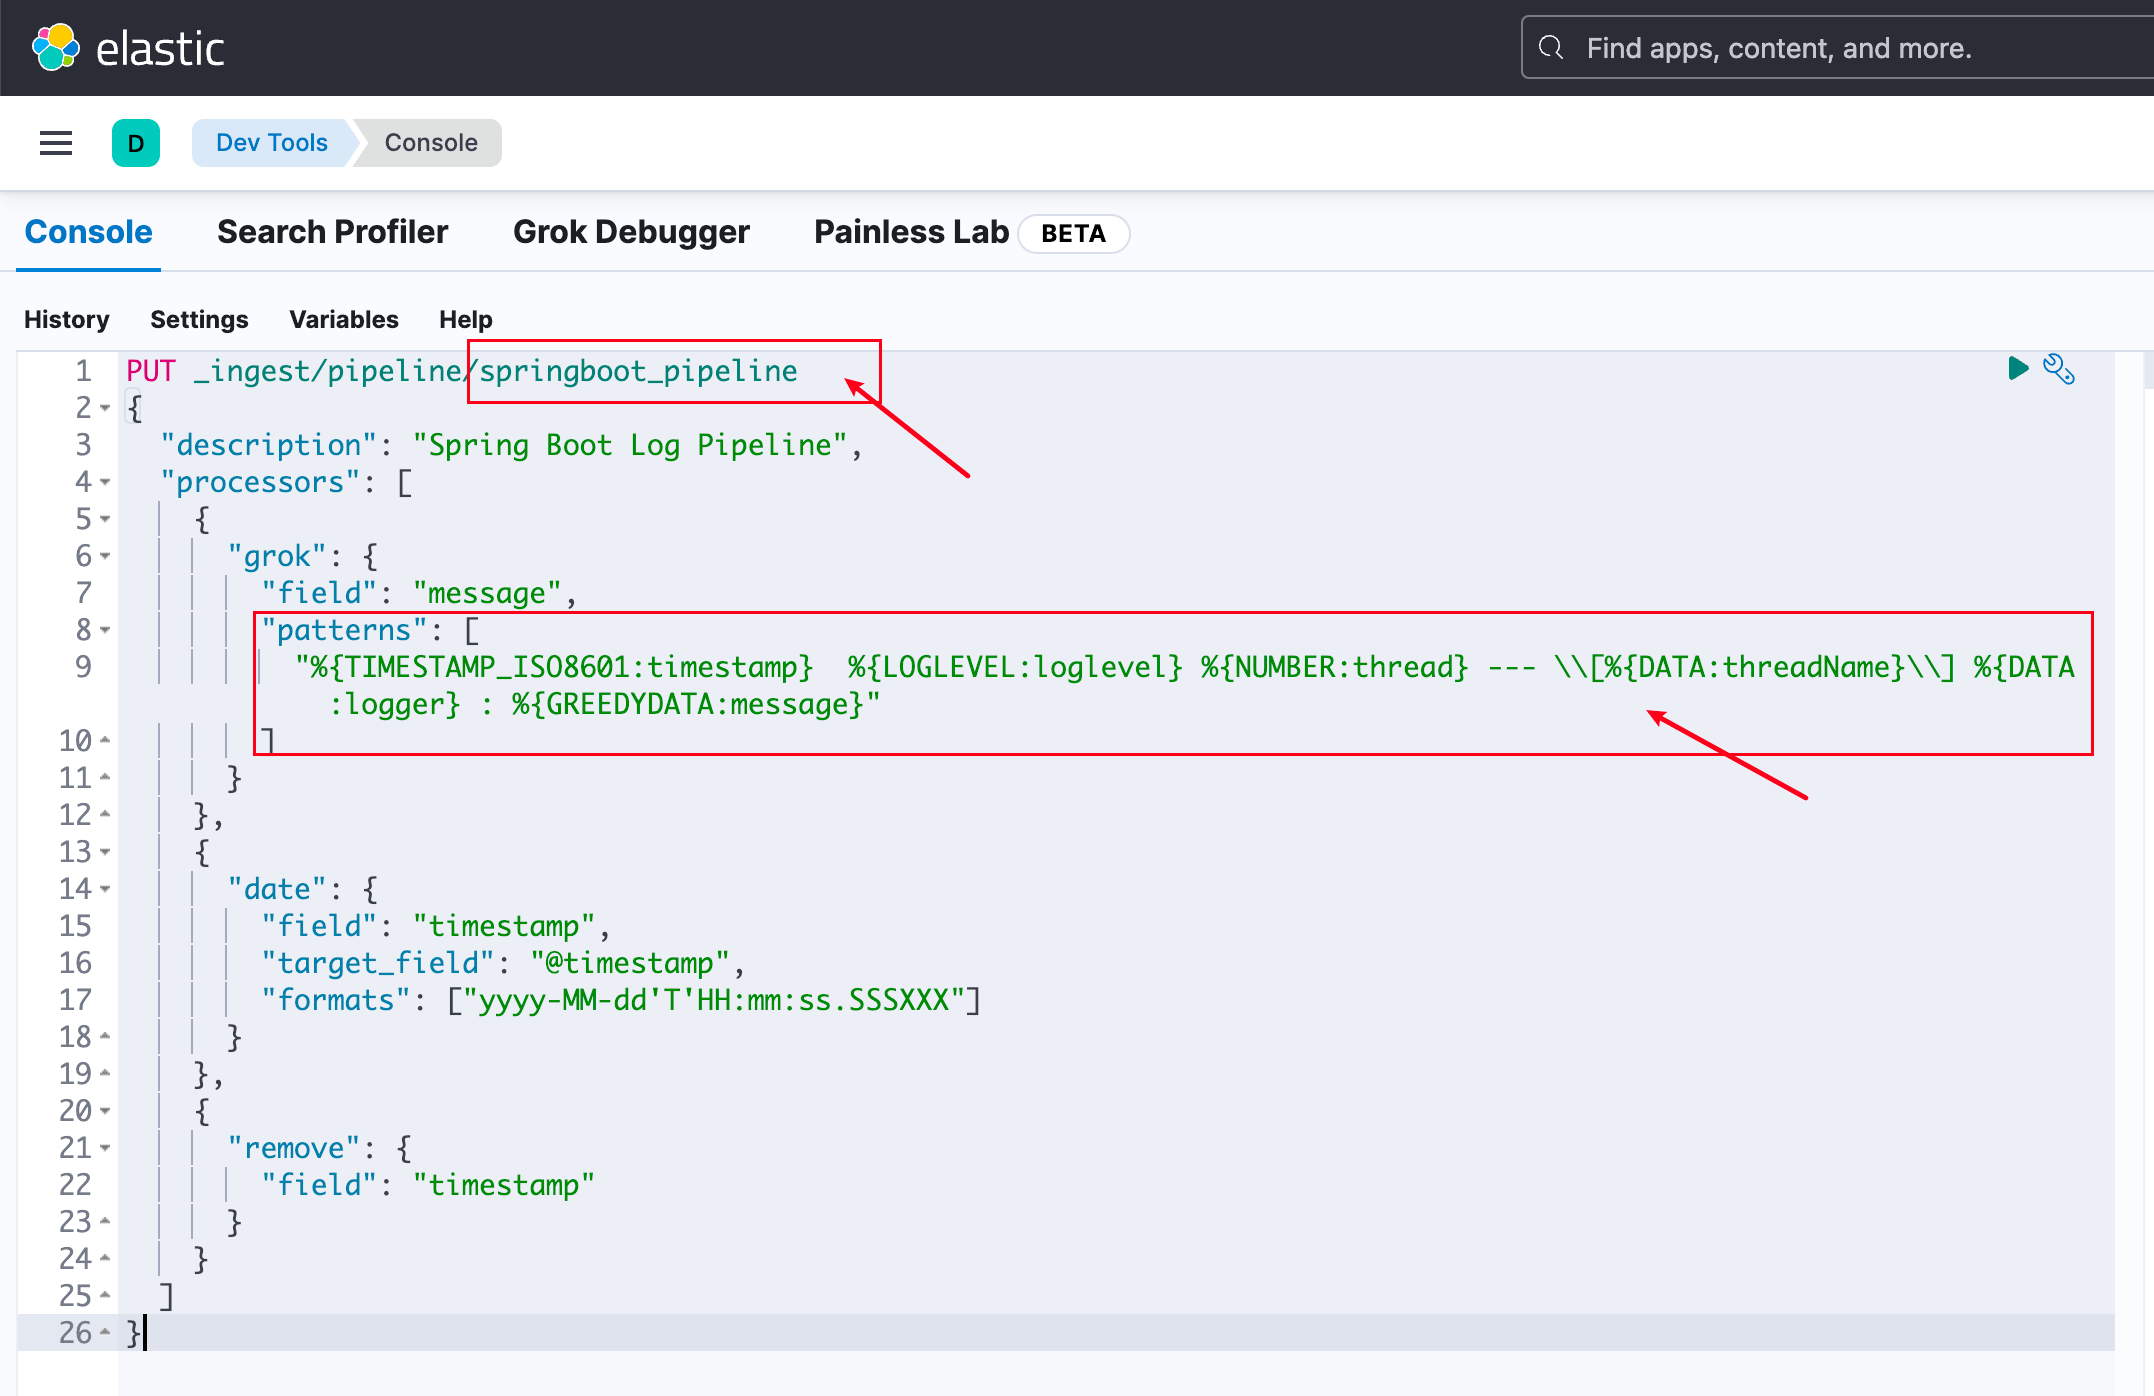
使用如下代码把springboot_pipeline写入ES,然后点一下右上角的运行按钮就行
PUT _ingest/pipeline/springboot_pipeline
{
  "description": "Spring Boot Log Pipeline",
  "processors": [
    {
      "grok": {
        "field": "message",
        "patterns": [
          "%{TIMESTAMP_ISO8601:timestamp}  %{LOGLEVEL:loglevel} %{NUMBER:thread} --- \\[%{DATA:threadName}\\] %{DATA:logger} : %{GREEDYDATA:message}"
        ]
      }
    },
    {
      "date": {
        "field": "timestamp",
        "target_field": "@timestamp",
        "formats": ["yyyy-MM-dd'T'HH:mm:ss.SSSXXX"]
      }
    },
    {
      "remove": {
        "field": "timestamp"
      }
    }
  ]
}
上面的这个命令你需要注意的是formats,如果时间格式对不上,会导致ES解析不了。
此时你的ES就有了这个pipeline,现在就剩下最后一步,运行filebeat容器了
2023-11-04 17:57:04 更新
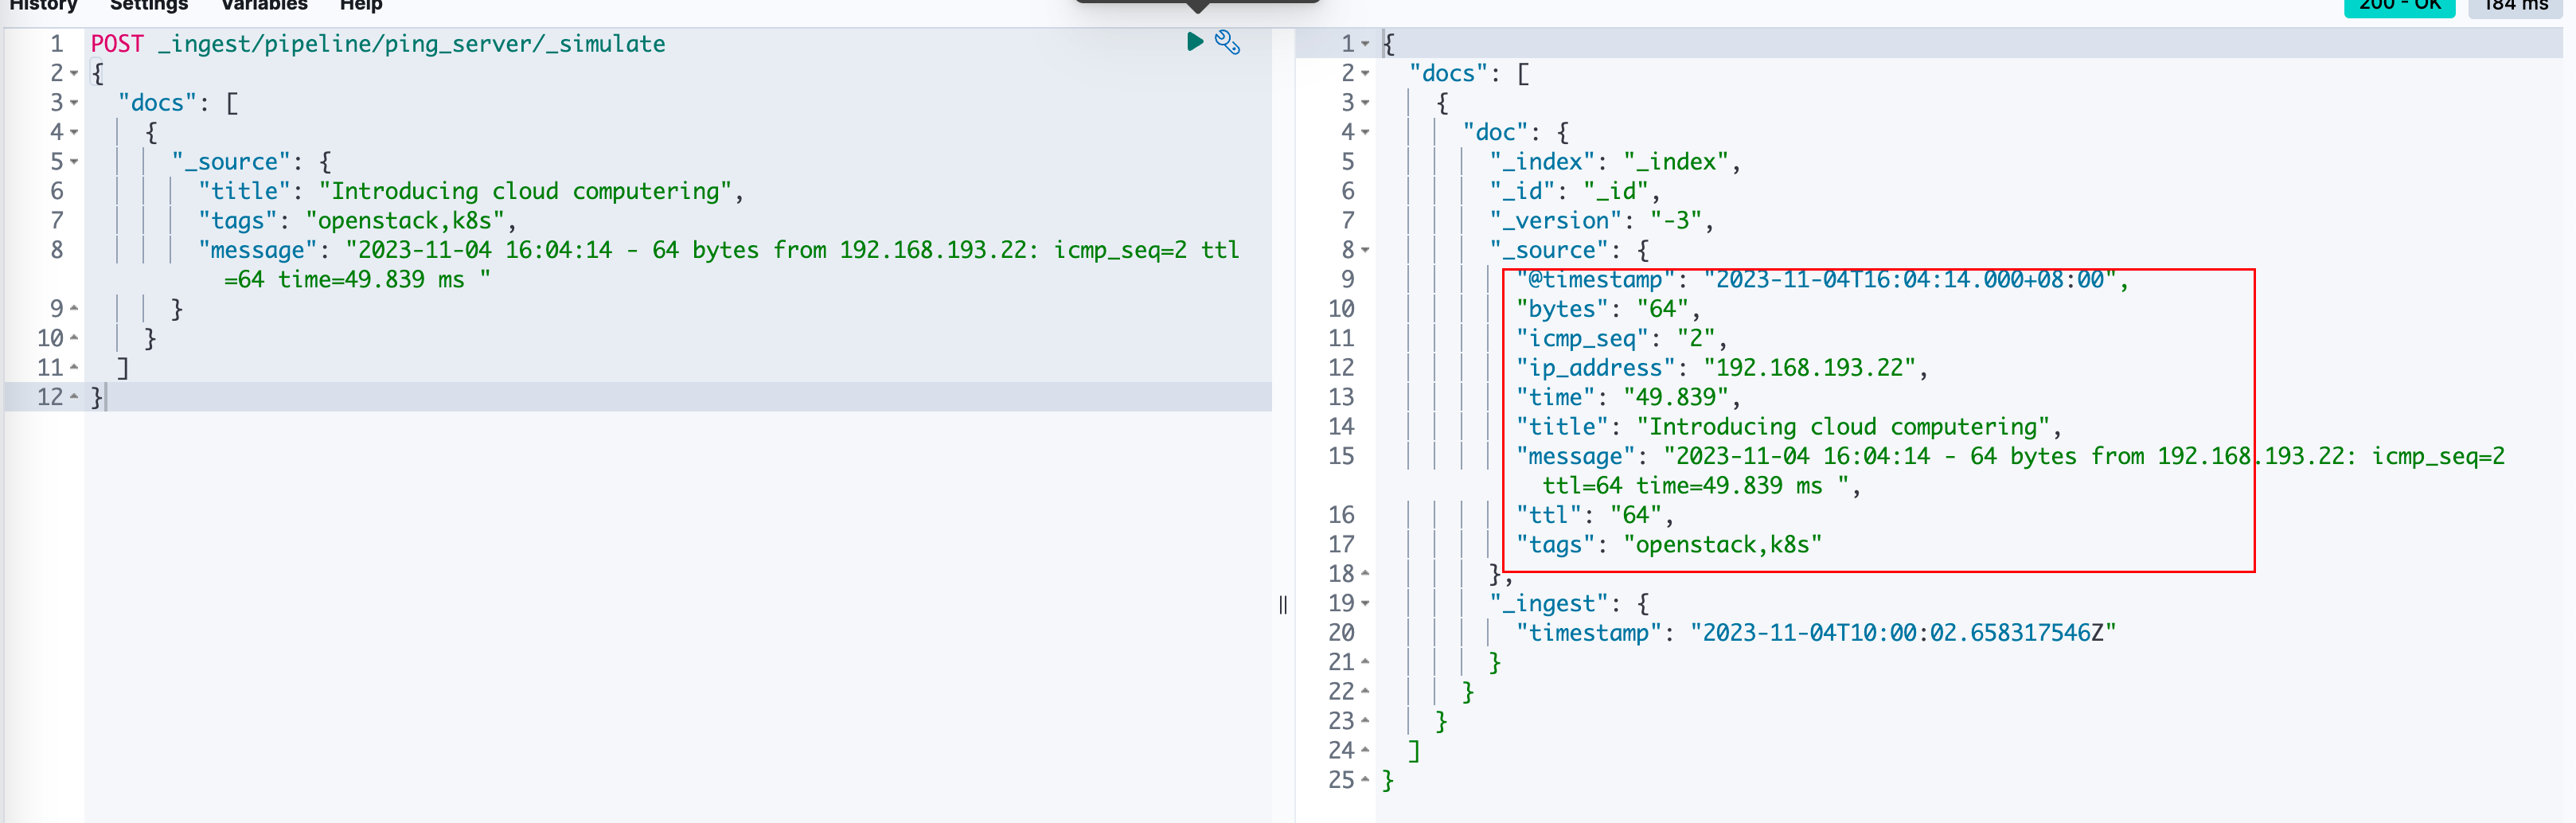
有了这个pipeline之后,如果还想直接验证一下怎么做呢,可以直接使用如下命令,在刚刚那个窗口再进行执行,如果有错误的话ES会直接抛出来。
POST _ingest/pipeline/ping_server/_simulate
{
  "docs": [
    {
      "_source": {
        "title": "Introducing cloud computering",
        "tags": "openstack,k8s",
        "message": "2023-11-04 16:04:14 - 64 bytes from 192.168.193.22: icmp_seq=2 ttl=64 time=49.839 ms "
      }
    }
  ]
}
正常执行时,如下:
3.3 docker启动filebeat
回到你的服务器终端,进入到放filebeat.yml 和http_ca.crt 目录,创建一个data目录用来放置filebeat的数据,否则容器删除新建会导致日志全部被重新推到ES,要是一年的数据重新推会想哭的。。。
mkdir data
这里我是放在同一个文件夹下,接着使用如下命令启动,你需要修改/share/Develop/dockerData/runnable-run/ 为你日志所在路径
docker run  \
  --name=filebeat \
  --user=root \
  --volume="$(pwd)/filebeat.yml:/usr/share/filebeat/filebeat.yml:ro" \
  --volume="$(pwd)/http_ca.crt:/usr/share/filebeat/http_ca.crt:ro" \
  --volume="$(pwd)/data/:/usr/share/filebeat/data/" \
  --volume="/share/Develop/dockerData/runnable-run/:/share/Develop/dockerData/runnable-run/:ro" \
  --volume="/var/lib/docker/containers:/var/lib/docker/containers:ro" \
  --volume="/var/run/docker.sock:/var/run/docker.sock:ro" \
  docker.elastic.co/beats/filebeat:8.8.0 filebeat -e --strict.perms=false
-user=root:以root用户身份运行容器,确保Filebeat有足够的权限来访问所需的资源和文件。-volume="$(pwd)/filebeat.yml:/usr/share/filebeat/filebeat.yml:ro":将主机当前目录下的filebeat.yml配置文件挂载到容器中的/usr/share/filebeat/filebeat.yml位置,并以只读模式(ro)挂载。--volume="$(pwd)/data/:/usr/share/filebeat/data/" 挂载filebeat的数据目录-volume="$(pwd)/http_ca.crt:/usr/share/filebeat/http_ca.crt:ro":将主机当前目录下的http_ca.crt证书文件挂载到容器中的/usr/share/filebeat/http_ca.crt位置,并以只读模式(ro)挂载。-volume="/share/Develop/dockerData/runnable-run/:/share/Develop/dockerData/runnable-run/:ro":将主机上的/share/Develop/dockerData/runnable-run/目录挂载到容器中的/share/Develop/dockerData/runnable-run/位置,并以只读模式(ro)挂载。-volume="/var/lib/docker/containers:/var/lib/docker/containers:ro":将主机上的/var/lib/docker/containers目录挂载到容器中的/var/lib/docker/containers位置,并以只读模式(ro)挂载。-volume="/var/run/docker.sock:/var/run/docker.sock:ro":将主机上的Docker守护进程的Unix域套接字挂载到容器中的/var/run/docker.sock位置,并以只读模式(ro)挂载。这是为了Filebeat能够与Docker守护进程通信,以获取Docker容器信息和日志。docker.elastic.co/beats/filebeat:8.8.0:指定要运行的Filebeat容器的镜像名称和版本号。filebeat -e --strict.perms=false:运行Filebeat容器时的命令,其中:
filebeat:表示执行Filebeat程序。e:以调试模式运行Filebeat,将日志输出到控制台。-strict.perms=false:禁用对配置文件权限的严格检查,这是为了兼容一些特定的容器环境,确保Filebeat能够读取配置文件和其他文件。
这里我没有设置-d是为了方便第一次启动的时候,你可以看到日志有真的被filebeat读取,并且推送到ES。
如果一切正常,那么你能看到日志输出有SpringBoot的日志内容,并且在Kibana上也能看到index被正确创建和有对应的数据,如图:
4. 异常处理
如果发现filebeat启动,但是没有推送日志到ES,以下是你需要检查的地方:
- 日志目录是否挂载正确到filebeat
- filebeat.yaml文件配置
springboot_pipeline 是否正确解析
也使用Del Tools直接测试你的grok pattern是否正确
5. 扩展部分
完成上述内容之后,其实意味着什么日志你都能丢给ES进行解析,只要是有格式输出的日志,直接自己写Grok Pattern。
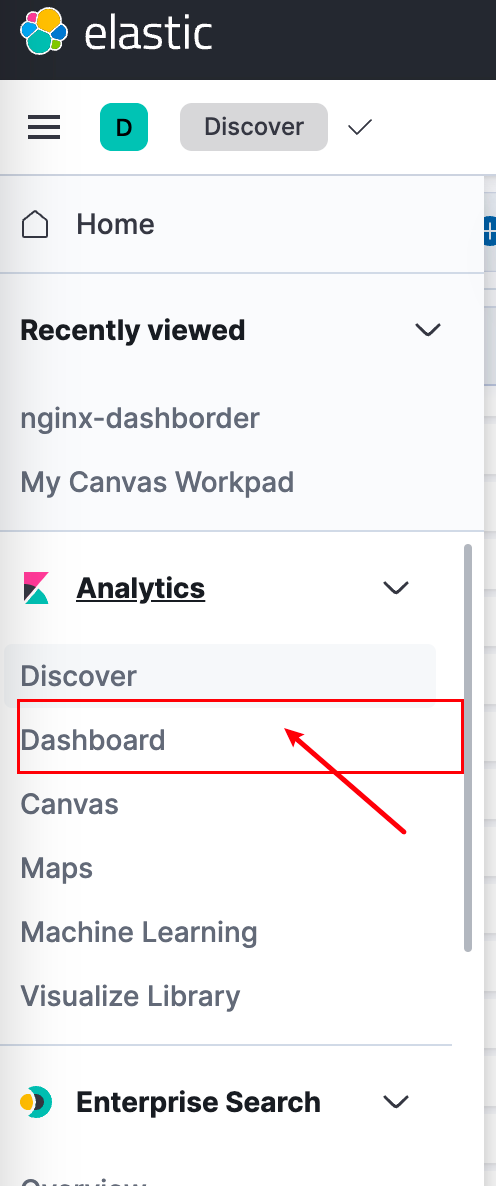
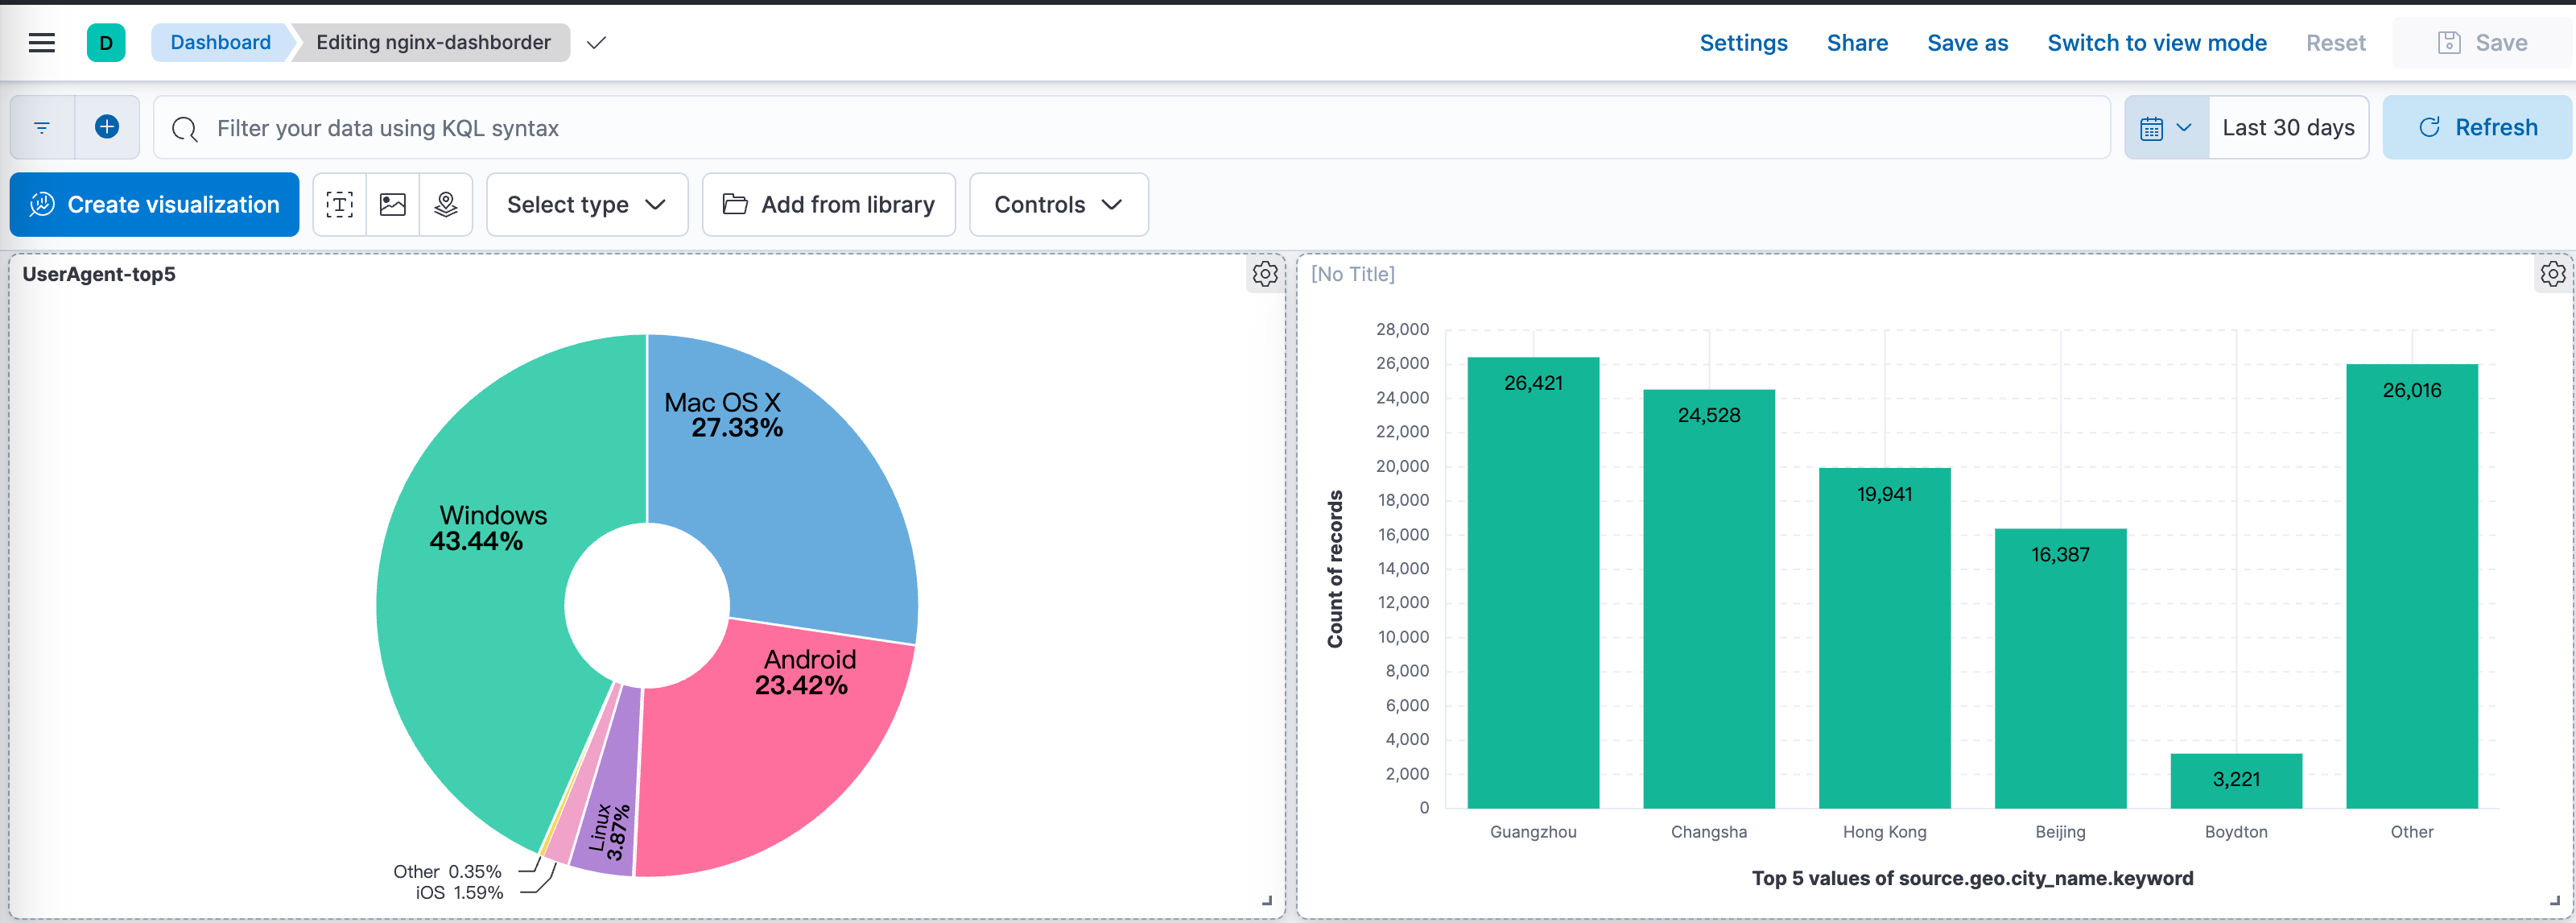
所以服务器上其他容器能输出日志的,和之前写的API生成日志全丢上去,然后好玩的来了,在ES的dashborder中,创建对应属性的统计不就是一个简单的监控大屏了嘛,比如nginx的日志放上去就直接能知道博客的ip请求统计。
这部分内容就需要你自己探索一下怎么玩了
比如我把nginx日志丢上去就发现近一个月,访问我博客最多的竟然有长沙地区的,而且安卓设备也不少。
参考内容
使用 Filebeat 收集 Docker 容器日志
Metricbeat : Certificate signed by unknow authority
input logs an error when an existing input is reloaded with the same ID
Parsing logback log files with filebeat and sending them to Elasticsearch
filebeat使用modules模板收集nginx日志(十) 原创
filebeat-installation-configuration.html